
Strategy (MSTR & STRC): Filtering the Noise
The stress test isn't theoretical anymore. In this research piece we explore what's happening in real time.
Purpose: In this research piece we explore what’s happening in real time, and how to tell whether it’s a normal oversold dislocation or the start of the reflexive downward spiral.
1. Executive Summary
This write up began as an effort to think through Strategy (MSTR common equity and STRC preferred) and cut through the noise to understand what is really going on beneath the hype and the fear-mongering. It is written as of June 30th, 2026, in the middle of a genuine stress test: bitcoin has slid below $60K, MSTR trades around the value of its own bitcoin rather than at a lofty premium, and STRC — marketed as a stable, near-par ‘digital credit’ instrument — has broken well below par to $75. So the questions in this piece aren’t hypothetical. They’re live.
We begin with the mechanics of the flywheel — how it works, how it feeds the mNAV premium, and how that premium drives the price of MSTR. From there we dig into what mNAV actually is, take a deep dive into STRC, and close with an overview of the major risks facing Strategy.
The single biggest risk to Strategy is that bitcoin trades sideways or down for several years and the upward momentum it has experienced since inception stalls. Bankruptcy and liquidation are remote, even at steep price declines. There is no compelling reason that mNAV would trade at a steep discount.
Takeaway — Solvency is not the real risk: momentum and confidence are. The structure can survive a deep, prolonged drawdown without going bankrupt; what it can’t easily survive is a multi-year stall that keeps the premium compressed and the flywheel idle. We see the current dislocation not as a systemic breakdown but as an attractive entry point — MSTR at a compressed premium with optionality on its re-expansion, and STRC at an elevated yield below par. Both reward patient capital.
2. What Strategy Actually Is & How the Flywheel Works
At its core, Strategy is a bitcoin-treasury company: it raises capital in the public markets and uses it to buy and hold bitcoin (currently on the order of 850K BTC). There is a legacy enterprise-analytics software business underneath, but it generates only ~$450–500M in flat-to-declining annual revenue — roughly 1–3% of the company’s value, virtually incidental to the valuation.
The flywheel is the self-reinforcing loop at the heart of the whole model. Here’s how it works, step by step, then why it’s called a flywheel (and when it can spin in reverse).

The Loop
Trade at a premium. MSTR’s stock trades above the value of its bitcoin (mNAV > 1.0x). The market is willing to pay, say, $1.30 for $1.00 of bitcoin exposure inside the wrapper.
Issue equity into that premium. The company sells new shares at the elevated, premium price.
Buy bitcoin with the proceeds. Because the shares were sold above mNAV, each dollar raised buys more bitcoin than the bitcoin-per-share it dilutes. The result: bitcoin-per-share rises for existing holders — the issuance is accretive (positive BTC Yield).
Accretion validates the premium. Existing shareholders are now richer in bitcoin terms despite the dilution. This ‘it works’ demonstration reinforces investor confidence and enthusiasm.
Confidence sustains/expands the premium. Rising bitcoin-per-share, positive momentum, and the narrative attract more buyers, keeping the stock above mNAV (often pushing the premium higher).
Repeat. Back to step 1 — the elevated premium enables the next accretive raise, and the loop spins again.
Numerical example: the flywheel with mNAV at a premium
Starting state:
Bitcoin held: 1,000 BTC
Bitcoin price: $100,000 → bitcoin value = $100M
Shares outstanding: 1,000,000
Bitcoin-per-share = 0.001 BTC/Share (1,000 BTC ÷ 1,000,000 Shares)
Share price = $150, so market cap = $150M→ mNAV = 1.5x ($150M ÷ $100M BTC value)
Now issue 100,000 new shares at the $150 market price:
Cash raised = 100,000 × $150 = $15M
Buy bitcoin with it: $15M ÷ $100,000 = 150 BTC
New state:
Bitcoin held: 1,150 BTC
Shares outstanding: 1,100,000
Bitcoin-per-share = 1,150 ÷ 1,100,000 = 0.001045 BTC
The result: bitcoin-per-share rose from 0.001000 to 0.001045 — a +4.5% increase for existing holders, despite issuing 10% more shares. That’s the accretion. Existing shareholders now own more bitcoin than before, even though they were diluted, because the new shares were sold at a premium and converted into bitcoin at mNAV. This example holds both prices constant — it assumes issuing shares doesn’t depress MSTR and buying bitcoin doesn’t bid it up. In practice, issuance and purchases are sized small enough relative to market depth not to move either price materially, so the simplification holds reasonably well.
Investors pay a premium because they expect bitcoin-per-share to rise over time and because MSTR offers leveraged bitcoin exposure without margin-call risk. That premium is itself the fuel: it’s what lets Strategy issue accretively and grow bitcoin-per-share. The paradox for a buyer is that the engine runs best at a high premium, but the entry is most attractive at a low one — where you’re paying little or nothing for the wrapper and getting optionality on the premium re-expanding.
The leverage amplifier
Layered on top, the company also issues convertible debt and preferred stock to buy bitcoin. This adds leverage: more bitcoin controlled per share without issuing common equity at all. In a rising market this amplifies bitcoin-per-share growth further, accelerating the flywheel beyond what equity issuance alone would achieve. (STRC preferred is the current primary fuel.)
Why ‘flywheel’
A flywheel stores momentum — once spinning, each push adds energy and it turns faster with less effort. Here, each accretive raise makes the next one easier by reinforcing the premium that enables it. The success feeds the conditions for more success. That’s the self-reinforcing, momentum-building quality the name captures.
The critical dependency — and reverse spin
The entire loop hinges on step 1: trading at a premium (mNAV > 1.0x). That’s the fuel. Remove it and the flywheel stalls — and can even work against it:
When mNAV falls to or below 1.0x, issuing common to buy bitcoin is no longer accretive — you’d be selling shares at or below the bitcoin they represent, which would dilute rather than grow bitcoin-per-share. So the flywheel stalls: Strategy simply stops issuing accretively and waits, rather than diluting existing holders. Importantly, a stall is not a collapse. The company isn’t forced to sell bitcoin or cut dividends the moment the premium disappears — those pressures only emerge after the cash reserve (currently ~17 months of dividend coverage, with a board-mandated 12-month floor) is exhausted, which is a multi-year runway. The genuine risk is a prolonged stall: if bitcoin stays flat or down long enough, a compressed premium and a draining reserve can eventually pressure the company toward harder choices, such as selling bitcoin. But in the near term, sub-1.0x mNAV means the engine idles — not that it runs in reverse.
This is exactly the regime Strategy is in now (mNAV ~1.0x), which is why it pivoted to preferred issuance (to keep raising without diluting common) and why the bears argue the flywheel has stalled. The flywheel is a bull-market machine — it spins beautifully when bitcoin rises and the premium is fat, and stalls when bitcoin is flat and the premium compresses.
Takeaway — The flywheel only spins above 1.0x mNAV. Above it, Strategy grows bitcoin-per-share for free; at or below it, the engine idles. Our view: a stall doesn’t violently reverse so much as go quiet, creating an attractive entry point for investors.
3. mNAV: Definition and Calculations
mNAV (‘modified Net Asset Value’): how much is the market paying for Strategy relative to the value of the bitcoin it holds?
mNAV = (the market’s valuation of the company) ÷ (the market value of the company’s bitcoin)
Naive version (common-equity-only)
mNAV = (MSTR market cap) ÷ (BTC holdings × BTC price)
NSC (net of senior claims) version
mNAV = (MSTR market cap) ÷ (BTC holdings × BTC price)*
*bitcoin net of the senior claims, total BTC value − debt − preferred + cash
Enterprise-value version
mNAV = (market cap + debt + preferred stock − cash) ÷ (BTC holdings × BTC price)
NSC mNAV is our preferred version. mNAV is a sentiment gauge layered on top of the bitcoin value. It can fall while bitcoin is going up, or vice versa.
If NSC mNAV > 1.0x issuing MSTR is accretive; otherwise it is dilutive.
Takeaway — Always know which mNAV someone is quoting. The NSC and EV versions are the best to use (with a slight preference to NSC) but sometimes they can differ by a wide margin given ~$22B of debt and preferred stacked on the bitcoin — so a single mNAV number, unlabeled, is close to meaningless.
4. mNAV: Premium / Discount and Returns

At the current NSC mNAV of 1.06x, the ~$22B of debt and preferreds gives MSTR roughly 1.7x leverage to bitcoin. Given the new competitors (other bitcoin DATs, ETFs, etc.) we do not expect mNAV to return to 2.0x or higher, but do believe it will stay rangebound for the immediate future and could get closer to 2.0x during another bull market.
The mNAV premium/discount is affected by a variety of intertwined factors that include:
Demand for leverage — appetite for a margin-call-free leveraged bitcoin vehicle; when investors want amplified exposure, they bid the premium up.
Bitcoin price optimism — bullishness on bitcoin itself; since MSTR is leveraged exposure, expected bitcoin upside gets amplified into a higher premium.
Confidence in future accretion — belief that Strategy can keep increasing bitcoin-per-share through accretive issuance, debt management, and capital-markets execution (i.e., the flywheel keeps working).
Confidence in the capital structure / solvency — reduced fear about the debt and preferred obligations, dividend sustainability, and funding access; lower perceived risk supports a higher premium.
Narrative / sentiment & trust in management — faith in Saylor’s execution and the ‘permanent holder’ story; momentum, retail enthusiasm, and brand all feed the premium.
Competition — how attractive MSTR looks versus alternatives (spot ETFs, other DATs); a widening edge over competitors lifts the premium.
The entanglement is real: a bitcoin rally simultaneously boosts price optimism, makes the leverage look smart, eases solvency fears, and energizes the narrative — so these rarely move independently, which is why a single mNAV number can’t tell you which factor is driving it.
Takeaway — At today’s compressed multiple, MSTR is roughly 1.7x leverage on bitcoin with optionality on the premium re-expanding. We don’t expect a return to 2x+ NSC mNAV given ETF and DAT competition, but a bull market could push it back toward 2x.
5. Competitive Landscape
The degree to which MSTR faces competition directly affects the premium it can command on its mNAV — and here, scale is the moat (the same dynamic you see in the ETF space). MSTR holds roughly 20x more bitcoin than Twenty One Capital (XXI) and 40x more than Strive (ASST); nobody is close. The newer entrants compete on structure and transparency instead. Strive explicitly mirrors Strategy’s playbook — its SATA preferred (variable-rate, ~13% APR) is a direct STRC analog funding bitcoin purchases — while Twenty One Capital leans on on-chain proof of reserves that Strategy doesn’t offer. They’re competing on ‘bitcoin-per-share’ purity precisely because they can’t compete on scale.

At the end of March, Twenty One Capital traded at a premium above its counterparts. One explanation for this is that it does not currently have preferred shares in its stack and does not have the burden of making regular dividend payments in this current bear market environment.
Where MSTR sits in the landscape of bitcoin leverage
In the landscape of bitcoin leverage, MSTR occupies a unique category of long-term leverage that protects the premium on its mNAV. Other ways to obtain leverage:
Leveraged bitcoin ETFs (e.g., 2x BITX) — daily-reset products that decay over time, so they’re built for short holds, not buy-and-hold. MSTR is long-term leverage with no decay.
Crypto perpetual futures (’perps’) — very high leverage (10x–125x), but funding-rate costs, liquidation risk, and limited US retail access. MSTR carries no funding cost or liquidation risk.
Regulated bitcoin futures (CME) — the institutional standard, but margin calls, roll costs/contango, and no accretion engine. MSTR has no margin calls, no roll, and can grow bitcoin-per-share.
Margin borrowing on spot BTC or an ETF — straightforward added leverage, but direct margin-call/liquidation risk. MSTR’s leverage sits at the corporate level, so the holder can’t be forced out.
If you want leverage you can hold through a brutal drawdown without being forced out — MSTR’s structural advantage is real and futures can’t replicate it. MSTR is long-term leverage. No margin call, no liquidation risk.
How or why have many other DATs failed?
Most DATs that failed could not kick-start the flywheel because their mNAVs were trading at a discount in a bear market, the worst time to start a DAT. As a result many pivoted to other lines of business.
Takeaway — MSTR’s edge has narrowed from ‘valuation premium’ to ‘scale, liquidity, and survivability.’ The clones (Twenty One Capital and Strive) compete on cleaner structures and transparency, and a newcomer like Twenty One can even out-premium the giant — but none can survive a downturn the way Strategy’s scale and liquidity let it.
6. STRC — The Deep Dive
STRC is essentially leverage that MSTR is paying for, which can help or hurt it depending on the direction bitcoin trades.
The ways in which STRC helps or hurts MSTR
STRC Helps
Accumulates bitcoin without diluting common equity, thus bitcoin-per-share increases. Common essentially pays the cost of the interest rate (~12%) but captures all the upside.
STRC acts as leverage without the downsides of debt (it never matures, can’t trigger a default, can be deferred in extremis, and has no covenants). In a bitcoin bull market it magnifies common upside dramatically.
Allows Strategy to accumulate bitcoin when mNAV premium is close to zero, valuable in the current environment when bitcoin prices are depressed.
Taps a cheaper, separate capital pool.
STRC Hurts
Inserts a large senior claim ahead of common.
Creates a fixed, rising cash drain on the common. The $1.1B/year obligation is serviced from the $2.6B USD cash reserve, which can be replenished by either issuing new preferred shares, MSTR shares (dilutive), or selling bitcoin.
Magnifies upsides and downsides. The obligation is in terms of dollars, so as the price of bitcoin falls, the obligation grows larger relative to underlying assets.
The ‘digital credit’ branding is a bit generous: STRC is structurally equity, junior to the convertibles, with discretionary dividends and no maturity — so while it behaves like fixed income in calm markets, calling it ‘credit’ lends it a seniority and certainty it doesn’t technically have.
Takeaway — STRC is regime-dependent: cheap, non-recourse leverage that juices the common equity in a bull market, and a rising senior cash-drain that increases pain in a bear market. Same instrument, opposite sign depending on which way bitcoin goes.
Funding STRC dividends
STRC obligations are currently about $90M/month or $1.1B/year. Relative to MSTR market cap, this is roughly 0.3%/month or 3%/year. Relative to the underlying bitcoin holdings this is 0.2%/month or 2%/year. As a response to the recent sell-off at the end of June, the board increased its USD cash reserves to $2.55 billion, which is 17 months of coverage for both STRC and other obligations.
STRC obligations, along with those of other preferreds and debt, are paid out of the USD reserve. To replenish the reserve, there are essentially three ways: issuing more STRC (or other preferreds), issuing MSTR, or selling bitcoin. Issuing STRC is efficient when it trades near par, while issuing MSTR is non-dilutive when NSC mNAV is above 1.0x. When both conditions hold, raising capital through share issuance is generally less destructive than selling bitcoin. But when STRC trades below par and mNAV sits at or below 1.0x, both share-issuance routes are impaired, and selling bitcoin can become the less destructive option. This is precisely why at the end of June management formalized the BTC monetization program: selling bitcoin is meant as a backstop to float the company through bear markets such as the one we are in now.
Note that although Strategy regularly issues more than $100M/month of MSTR, MSTR issuance is almost always used to buy more bitcoin, and issuing MSTR to pay preferred dividends would be purely dilutive because the proceeds go to STRC holders rather than to buying bitcoin.
STRC mechanics
Who changes it, and the legal authority
The board adjusts the rate, on management’s recommendation, in Strategy’s ‘sole and absolute discretion.’ The rate adjustment is discretionary, not formulaic. The published framework (below) is management’s stated intention, not a binding contractual obligation.
When the rate changes (the timing)
The rate is set per monthly Regular Dividend Period. To change it, Strategy must give notice of the new rate to holders before the first business day of the dividend period in which it applies. So the cadence is monthly: each month’s rate is announced just before that month begins, based on the prior period’s trading. Rate resets monthly but is paid semi-monthly to reduce ex-dividend fluctuations in price.
The published adjustment framework (management’s guidance, tied to VWAP)
Management evaluates both a full-month VWAP and, in the updated version, a five-trading-day VWAP for the days prior to month-end. The bands:
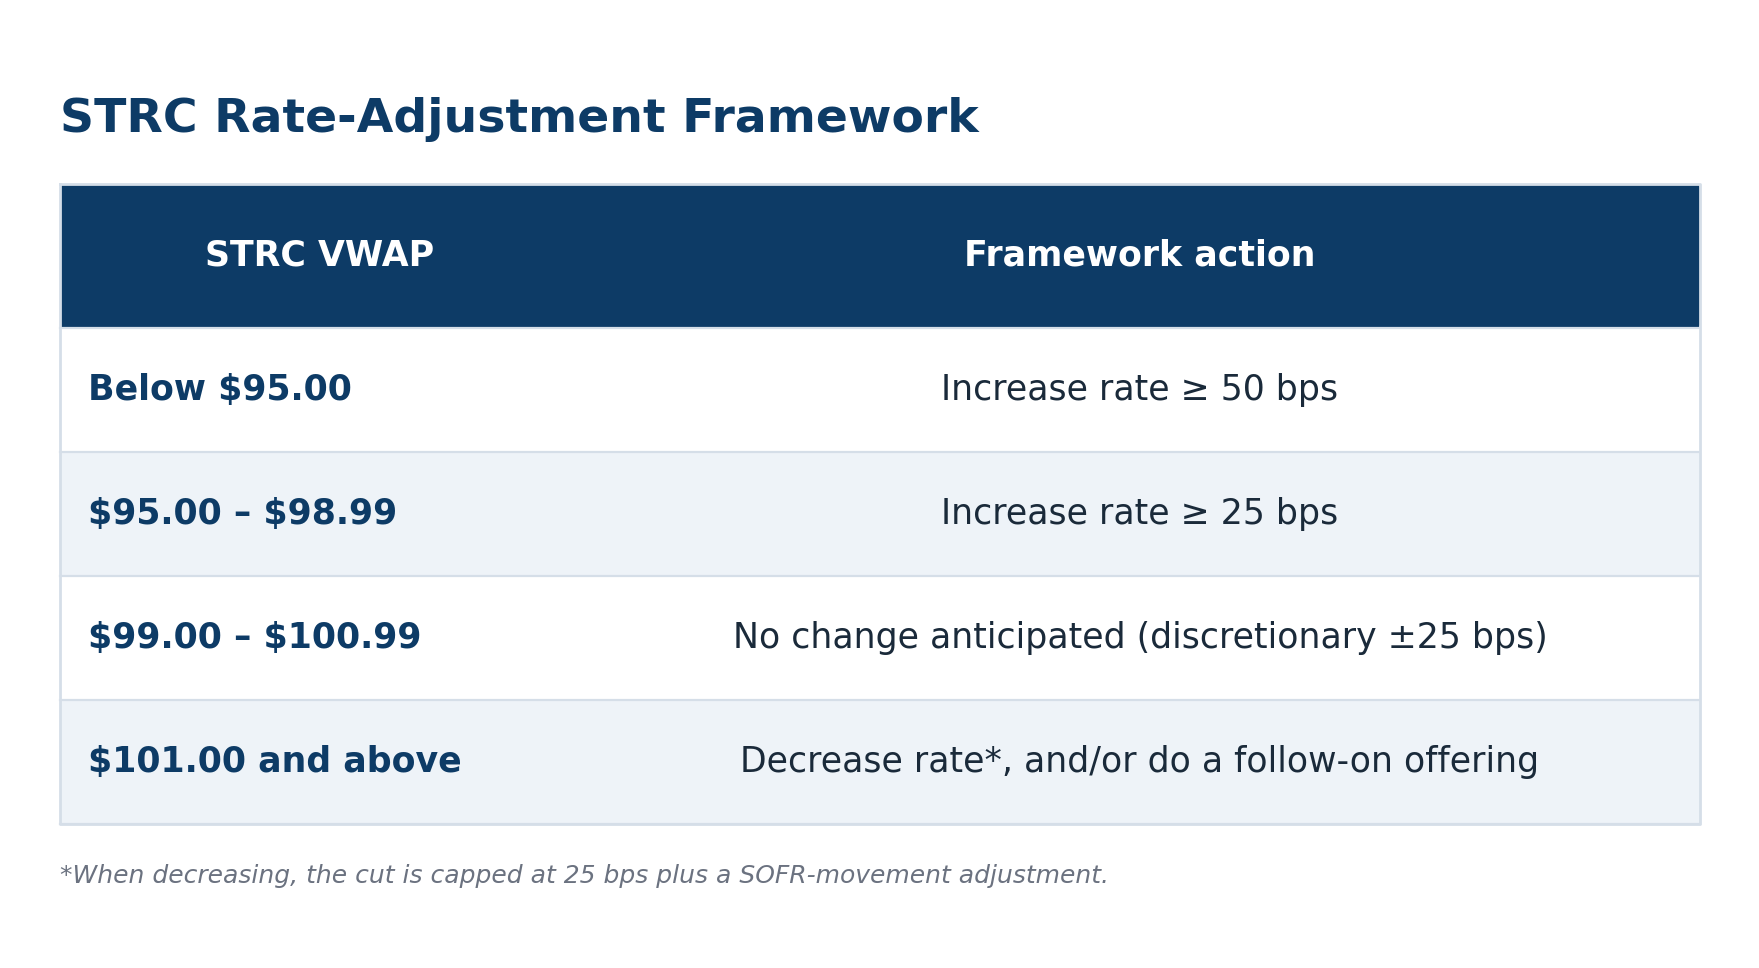
The logic is a thermostat: below par → raise yield to attract buyers and lift the price; above par → cut yield (or issue more supply) to bring it down. This framework produced seven straight increases (9.00% → 11.50%) from launch through March 2026, then three months of holds (April–June) as VWAP sat near $99.95, until the most recent increase by 50bps to 12.00% for July.
Takeaway — STRC’s rate is a discretionary thermostat: raise it to defend par when the price sags, cut it when it runs hot. Increases are essentially unconstrained; cuts are capped (~25 bps + SOFR adjustment) and can never go below SOFR. The catch — raising the rate to defend par also raises the obligation, which is exacerbated in a bear market.
7. Where the Real Risks Are
This is the heart of the piece. Below we work through the risks that actually matter — and a couple that get more airtime than they deserve.
The 2022 bear market — the model’s prior stress test
It’s worth remembering the model has already survived one brutal stress test. In the 2022 crypto bear market, bitcoin fell ~75% from its late-2021 highs and MSTR dropped roughly 90% from peak to trough. At the time, Strategy carried a ~$200M bitcoin-collateralized loan from Silvergate, and as prices fell the market openly speculated about a margin call on that loan — a genuine forced-liquidation scenario. Strategy posted additional collateral to stay ahead of it and later repaid the loan in full (at a discount), and critically, it has since moved away from collateralized debt toward the convertible notes and perpetual preferreds that can’t trigger a margin call. So the precedent is double-edged: on one hand, the company endured a ~90% drawdown without being forced to liquidate its bitcoin, which bulls cite as proof of resilience; on the other, it came closer to the edge than is comfortable, and only restructured the most dangerous part of its capital stack afterward. The current structure is more robust than 2022’s, but the episode is a reminder that ‘remote’ risks become vivid in a deep enough downturn.
The STRC stablecoin contagion (apxUSD) and leverage in the holder base
STRC’s June 2026 slide below par revealed hidden fragility beneath its ‘stable, near-par digital credit’ marketing. Two linked factors amplified the drop. First, a meaningful portion of STRC was held on margin — investors had borrowed against the shares to juice the ~11–12% yield, on the assumption it would hold near $100. As the price slipped, those leveraged holders hit margin calls, triggering forced selling that fed on itself in a classic liquidation cascade. Second, a stablecoin (Apyx’s apxUSD) was backed substantially by STRC shares; as STRC fell, that stablecoin wobbled toward $0.90, creating an additional, unexpected channel of STRC-specific selling pressure. Together they undercut the instrument’s ‘savings-account-like’ framing — an asset being bought on leverage and used as stablecoin collateral is structurally far more volatile than its near-par branding implies, and the episode showed how interconnected, reflexive risks can turn a modest dislocation into a sharp one. It also suggests the recent price movement is temporary in nature rather than a long-term repricing of Strategy’s ability to pay dividends on STRC.
The ‘moved the goalposts’ pattern / management credibility
Management’s stated commitments have a habit of bending under pressure. In July 2025, Strategy pledged not to issue MSTR below 2.5x mNAV — then dropped the floor a month later when the premium compressed. The ‘never sell’ bitcoin doctrine was reversed in 2026, with Saylor recasting his past absolutes as ‘misinterpreted.’ Defenders call these rational adaptations, noting the actual latitude was always disclosed in filings. Critics see a pattern: firm-sounding principles that soften whenever they constrain the company — a reason to weight Strategy’s actions over its promises.
Governance and key-man risk
Strategy is, to an unusual degree, one person. Saylor is founder, executive chairman, and — via Class B shares carrying 10 votes each — the largest voting bloc and effective decision-maker. The treasury pivot, capital structure, ‘never sell’ doctrine, and issuance philosophy all flow from him. That concentration has enabled fast, conviction-driven moves a normal board would block, but it makes succession or a change of heart genuine risks. Continuous issuance has diluted Saylor below 50% voting control (costing the Nasdaq ‘controlled company’ exemption and forcing a majority-independent board), so formal checks have grown — but in practice he still drives the strategy. Investors are largely betting on one person’s judgment.
Strategy opens the door to selling bitcoin
By most accounts, Saylor has been on the record multiple times stating Strategy would never sell its bitcoin; however, in May reversed his stance, saying his past comments were misinterpreted and that Strategy can sell bitcoin. Whether this is a betrayal or an evolution in Strategy’s strategy is a matter of opinion. The never-sell doctrine was a cornerstone of their identity and the change has damaged trust among certain investors.
Has the upward price of bitcoin been a result of, or supported by, MSTR buying bitcoin?
Strategy was plausibly a meaningful contributor and catalyst — especially as the pioneer that legitimized and demonstrated the corporate-treasury demand category, and as a real supply sink in specific quarters — but almost certainly not the primary driver of the 2020–2026 price appreciation, which is better explained by the macro liquidity cycle, halvings, the spot-ETF demand shock, and the broad institutional-adoption S-curve.
Takeaway — The risks that matter are cash-flow and confidence, not solvency. Bitcoin >> debt, the debt has no covenants or margin calls, and 2022 proved the model survives a ~90% drawdown. What can stall is the funding loop and the narrative — and the broken ‘never sell’ promise plus the STRC dislocation are live examples of that confidence risk in action.
8. The Stress Test in Real Time — Conclusion
As of June 30th, 2026, the bear scenario this note keeps returning to is no longer hypothetical: bitcoin is below $60K, MSTR’s mNAV has compressed to roughly parity, and STRC has broken hard below par. The question for anyone holding — or considering — MSTR or STRC is which story is unfolding:
The benign reading: STRC was never truly pegged, only managed toward par; its drop is the market repricing the yield it demands, amplified by forced deleveraging of margined holders and the apxUSD stablecoin linkage. On this view it’s an oversold dislocation that mean-reverts, not a structural break.
The bear reading (the reflexive spiral): sub-par STRC forces rate hikes → bigger obligation → increased risk of bitcoin sales/dilution → compressed mNAV → closed equity issuance → a self-reinforcing downward loop. The paused STRC issuance is the early sign.
Our base case remains that solvency was never the real question — Strategy can stall for years without going bankrupt. Selling bitcoin as a last resort only comes into play around 2028, and only if the ~$2.5B USD reserve has been fully drawn paying obligations while bitcoin still languishes near $60K or below. That is a narrow, multi-year tail, not an imminent threat.
Takeaway — An investment in Strategy ultimately rests on a single conviction: that bitcoin appreciates meaningfully over the long term. Everything else is mechanics. Get that call right, and the capital structure is built to compound it; get it wrong, and no amount of financial engineering will save it. We believe in the long-term potential of bitcoin.
Appendix
The Capital Stack
Convertible debt — senior to all preferreds (ranked equally among themselves)

Preferred stock — all perpetual (no maturity), junior to debt, senior to common equity

Takeaway — Order of priority, top to bottom: convertible debt → STRF → STRC → STRK → STRD → common. STRD is the only non-cumulative preferred (its dividend can be skipped permanently), and STRK is the only convertible one. STRC is the giant, at roughly $9B of the ~$15.5B preferred stack.
BTC Yield and Sats-per-Share
Calculating BTC Yield
Strategy’s own proprietary KPI, it is not a yield in a traditional financial sense. It’s not income, interest or a cash return. It measures the percentage change in bitcoin-per-share over a period of time. Specifically:
BTC Yield = (BTC-per-share at end of period – BTC-per-share at start) / (BTC-per-share at start)
Where BTC-per-share = total bitcoin held / assumed fully-diluted* shares outstanding
*Includes shares issuable from convertible notes, options, and other dilutive instruments, not just current common shares.
As of June 30th 2026 there are 211K sats-per-share, with a YTD BTC Yield of 8% and 2025 BTC Yield of ~20%.
This measure does not take into account the senior claims stacked on top of common shares, which in our opinion is something investors need to compensate for.
Sats-per-Share
One bitcoin is worth 100,000,000 sats. Sats-per-share, as calculated by Strategy, has gone up because convertible debt, and especially the recently issued STRC preferred, add significantly to bitcoin holdings without diluting common equity (MSTR). The weakness with this method is that although it measures diluted shares which is conservative, it ignores the senior claims which is much too generous and cannot be ignored. The problem with including senior claims (calculating BTC holdings after deducting them) is that these claims are denominated in dollars and act as effective leverage. Consequently, when the bitcoin price rises or falls, the BTC-per-share moves correspondingly, all other things held equal.
The main point is that issuing preferreds at the moment they are issued does not add to bitcoin-per-share because the bitcoin added is exactly offset by the liability. But it does add leverage so when bitcoin price goes up, the BTC/share will go up and so should MSTR.
Takeaway — BTC Yield measures bitcoin-per-share growth, not return — and it ignores the senior claims stacked ahead of the common. It’s a real accretion metric, but it flatters the headline by leaving out the growing liability used to produce it.
If you encounter a paywall on any of the linked resources, feel free to reach out—I’d be happy to share the full content.
If you found this newsletter valuable, please consider sharing it with others.
Mike Treidl, CFA | Founder & CIO @ Blue Coin Capital
Disclosures & Disclaimers
The information contained in this newsletter is for informational purposes only and does not constitute investment, legal, or tax advice. Blue Coin Capital is an investment adviser that manages digital asset strategies for qualified investors. Nothing herein should be interpreted as an offer to sell, or a solicitation of an offer to buy, any securities or investment products.
Opinions expressed are current as of the date of publication and subject to change without notice. Certain content may reflect the views of Blue Coin Capital and its personnel and may include forward-looking statements that are not guarantees of future performance.
Digital assets, including cryptocurrencies and stablecoins, are speculative and involve a high degree of risk. Past performance is not indicative of future results. Always conduct your own research and consult with a qualified professional before making any investment decisions.
Blue Coin Capital, LLC is a California limited liability company.